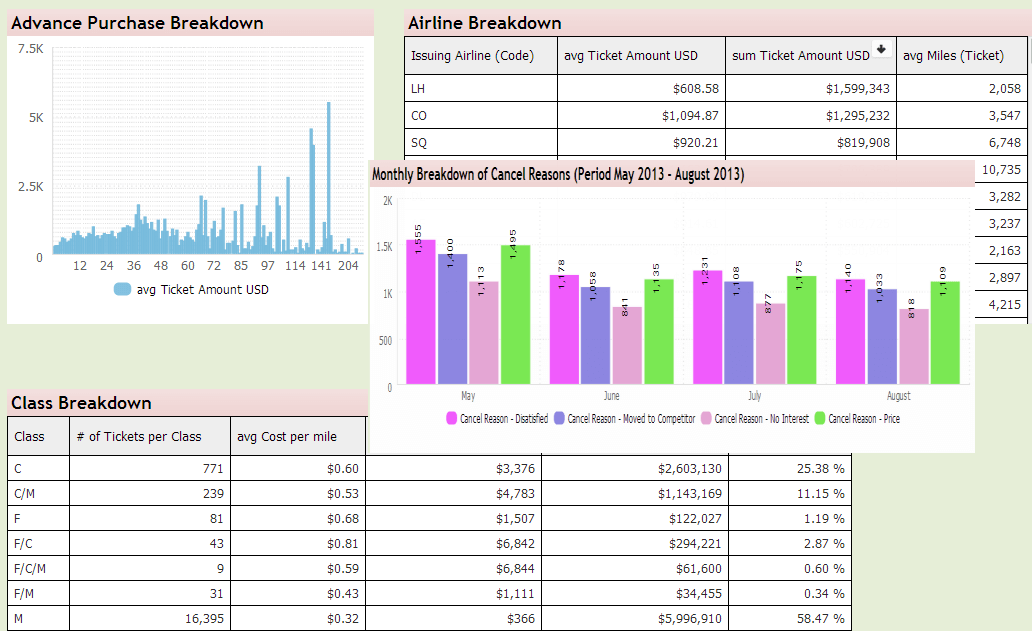
Dashboards, Scorecards, BI tools, Visualization
Our differentiating factor:
We integrate the results and outcomes of the Predictive Analytics models we developed for you in our Dashboards. In addition to data mining, you can now see in real time the impact of actions taken based on the models implemented and subsequent actions.
We also integrate the results of NPS survey with your customer demographic and billing data.
Manage all your data in one place, create visual dashboards to track key metrics and KPIs, set-up automated reporting and perform ad-hoc data analysis.
- Why use our services to create and turn raw data into actionable insight:
- You wish to integrate the outcomes and results of the predictive analysis
- You wish to report and visualize the impact of the actions you are taking
- You need to automate your manual and repetitive reporting tasks.
- You have multiple data sources that you want to use in a single report.
- You prefer visual and interactive dashboards over static reports.
- You manage data and/or reporting for multiple people.
- You own more data than Excel (or other traditional tools) can handle.
Our Dashboards bring you an end-to-end solution that provides a rich gallery of unique data visualization capabilities that would cast a shadow even on best-of-breed data visualization tools. But just as importantly, it provides comprehensive data storage and Optimization features that enables any business to implement and deploy scalable analytics.


